Unit 5
Examples
of Materials Selection
I.
A light-strong shaft –
example from Materials Science and Engineering – An Introduction, William D.
Callister, Jr., John Wiley, 2000
A)
Consider a shaft of
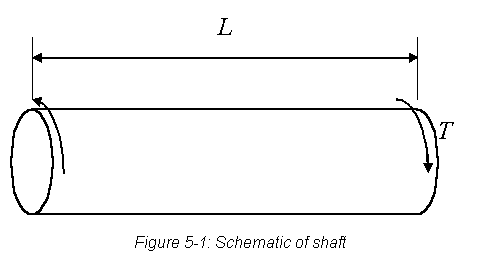
length L subject to a torque T, as shown in Figure 5-1 below.
B)
The maximum shear
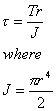
stress on the surface of the shaft is given by
1)
In the above equations, r is the
radius of the shaft and J is the polar moment of inertia.
2)
Therefore,

B)
If the design factor of
safety is Sf, then the shear strength of the material,  should be

The mass of the shaft is given by

The radius of the shaft is therefore
related to the mass by the equation

Substituting this value of r into the
equation for the required strength of the material yields
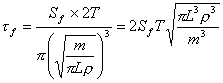
The mass of the shaft is then given by
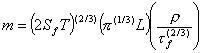
The items in the first parenthesis relate
to the functional requirements for the shaft, and the items in the second
parenthesis to the geometric constraints.
C)
Minimization of the
mass of the shaft by materials selection would therefore require the
minimization of the items in the third parenthesis.
1)
The performance index
for this application is:

2)
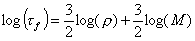
Taking the logarithm of
both sides of the above equation and rearranging the terms yields
D)
We can now proceed to
use a materials selection chart to pick the most suitable material.
1)
 Different values of the performance index correspond
to lines that are parallel to the
 guideline in Figure 5-2.
2)
The four blue lines
correspond to performance index values of 3, 10, 30 and 100 (MPa)(2/3)m3/Mg.
E)
The selection process
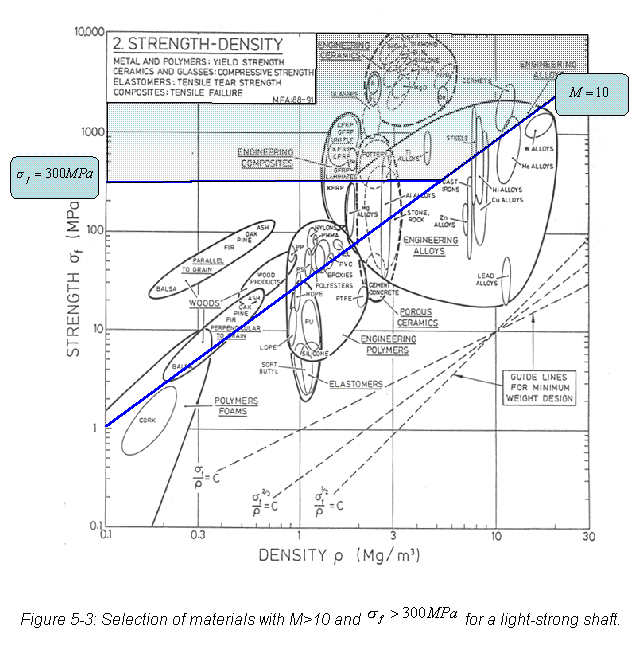
involves picking one of the performance index lines, say M=30 (MPa)(2/3)m3/Mg,
as shown in Figure 5-3.
1)
All materials that lie
above this line will meet or exceed the chosen performance index value.
2)
These include many
woods, composite materials, engineering ceramics and some engineering alloys.
3)
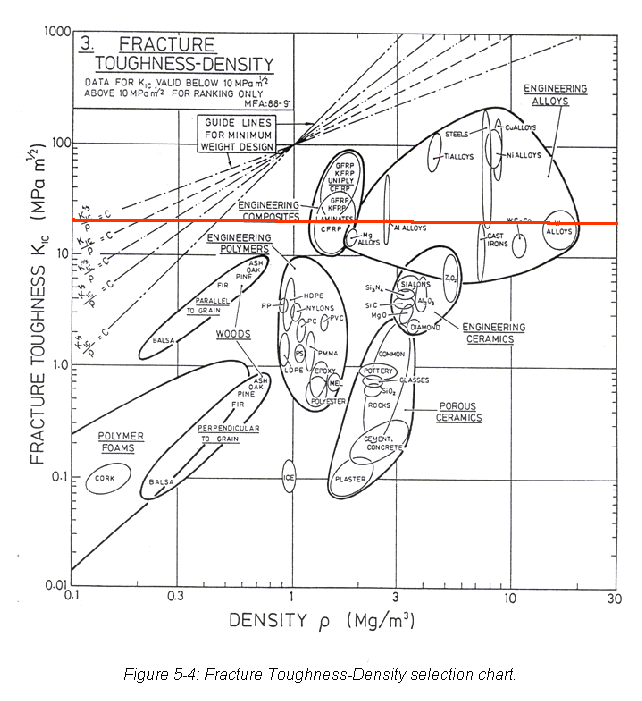
Engineering
applications generally require that the fracture toughness of the material be
greater than 20 MPa-m(1/2).
A quick look at Figure 5-4 will indicate that ceramics, wood and
polymeric materials do not meet this criterion, and can therefore be eliminated
from the list of potential materials.
4)
We can now impose an
additional constraint on the problem that the strength of the material be
greater than 300 MPa, as indicated by the horizontal line on Figure 5-3. This restricts the choice of materials to
the shaded region in the figure.
5)
At this point we are
ready to evaluate specific materials within the classes that satisfy the
constraints.
6)
Table 5-1 shows the
properties of five such materials.

7)
The five materials
selected are Carbon fiber reinforced composite – CFRC (65 vol% fiber helically
wound at 45° to the shaft axis),
Glass fiber-reinforced composite – GFRC (65 vol% fiber helically wound at 45° to the shaft axis), Aluminum alloy 6061-T6, Titanium
alloy Ti-6Al-4V, and 4340 steel (oil quenched and tempered). The properties of these materials can be
obtained from handbooks or standard textbooks, such as that by Callister.

8)
Table 5-1 shows that
based on the performance index the best material for the application is Carbon Fiber
Reinforced Composite.
9)
However, if we now take
cost into account, the picture is different.
a)
In order to make cost
comparisons, one usually normalizes the cost per kg of the material with
respect to the cost per kg of a common material, such as plain carbon steel.
b)
In making such
normalization, the assumption is that the cost of materials change with time,
but the relative costs do not change significantly.
c)
Tables of relative
costs are also usually available in handbooks or in standard textbooks like that
by Callister.
10) Table 5-2 shows the relative rankings of the five
materials after costs are taken into consideration. This table shows that for the light-strong shaft, 4340 steel is
the most economical, while Ti-6Al-4V is the most expensive.

II.
Materials for
Flywheels – example from Materials Selection in Mechanical Design, M.F.
Ashby, Pergamon Press, 1992
A)
Flywheels are energy
storage devices that work on the principle that a rotating mass possesses
kinetic energy. They are used in a
variety of applications, such as children’s toys, locomotives, windmills, and
regenerative braking systems.
B)
An efficient flywheel
would be one that stores as much energy per unit mass without failing.
1)

A typical flywheel is a disk, of radius R and
thickness t, rotating at an angular velocity  .
2)
The energy U stored
in the flywheel is:

where J is the polar moment of inertia,
given by.

 is the density of the
material of the disk. Therefore,

3)
The mass of the disk
is:

4)
The energy stored per
unit mass is therefore

5)
The maximum principal
stress that develops in a solid disk as it spins is given by
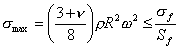
where  is the Poisson’s
ratio,
 is the failure stress
and Sf is the factor of safety.
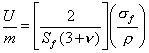
6)
Rearranging the terms
in the above two equations gives
7)
The Poisson’s ratio for
most engineering materials is about (1/3).
So in order to maximize the energy stored per unit mass, one needs to
maximize the performance index M given by

C)
The selection of
candidate materials can be made on the basis of those that maximize M.
1)
The appropriate
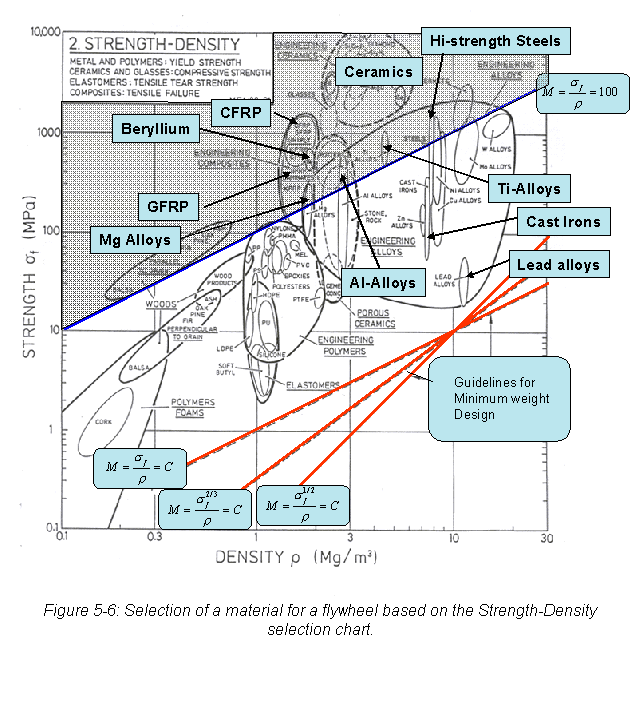
materials selection chart for this application is the Strength-Density chart
shown in Figure 5-6.
2)
The shaded region in the chart identifies
materials that satisfy a minimum performance requirement of 100 kJ/kg.
3)
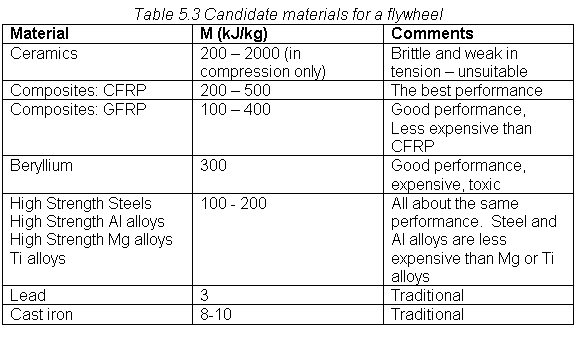
The candidate materials
from the chart are listed in Table 5.3
a)
In addition to the high
performing materials, two others, lead and cast-iron are also listed because
they have traditionally been used for flywheels.
4)
Ceramics can be
eliminated since the primary loading is in tension, and ceramics have very poor
tensile strength,
5)
Beryllium is both
expensive and toxic.
6)
The metallic alloys all
perform at about the same level.
7)
The best choices are
therefore Carbon Fiber Reinforced Polymers (CFRP) or Glass Fiber Reinforced
Polymers (GFRP)
a)
CFRP has a higher
performance index, but is more expensive than GFRP.
8)
Lead is traditionally
used as the flywheel material in children’s toys. Though it has a very low performance index, the chances of
reaching an angular velocity large enough to cause disintegration are very low
in the case of toys.
9)
Cast iron also is a
little better than lead, and inexpensive.